Thursday, September 20, 2018

The Spinning Top and The Dojis

The Spinning Top

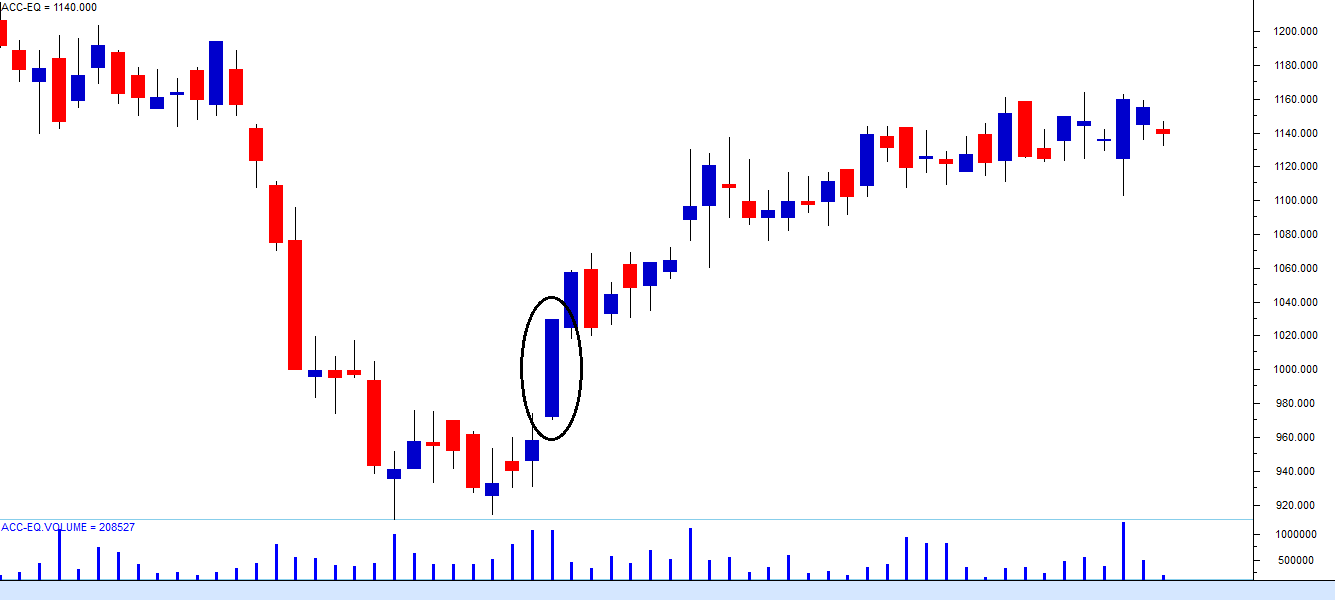
The spinning top is a very interesting candlestick. Unlike the Marubuzo, it does not give the trader a trading signal with specific entry or an exit point. However the spinning top gives out useful information with regard to the current situation in the market. The trader can use this information to position himself in the market.

Two things are quite prominent…


  • The candles have a small real body
  •  The upper and lower shadow are almost equal
If you look at a spinning top in isolation it does not mean much. It just conveys indecision as both bulls and bears were not able to influence the markets. However when you see the spinning top with respect to the trend in the chart it gives out a really powerful message based on which you can position your stance in the markets.

To sum up, the spinning top candle shows confusion and indecision in the market with an equal probability of reversal or continuation. Until the situation becomes clear the traders should be cautious and they should minimize their position size.
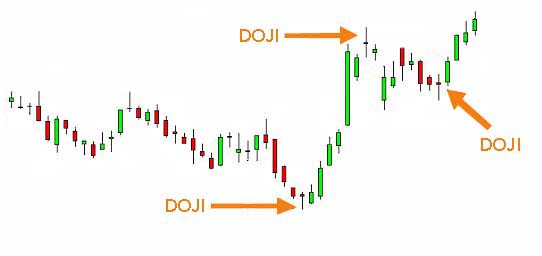
Image result for spinning top trend

The Dojis

The Doji’s are very similar to the spinning tops, except that it does not have a real body at all. This means the open and close prices are equal. Doji’s provide crucial information about the market sentiments and is an important candlestick pattern.

The Dojis have similar implications as the spinning top.

So the next time you see either a Spinning top or a Doji individually or in a cluster, remember there is indecision is the market. The market could swing either ways and you need to build a stance that adapts to the expected movement in the market.

Image result for doji candlestick

Key Points

  1. A spinning top has a small real body. The upper and lower shadows are almost equal in length
  2. The colour of the spinning top does not matter. What matters is the fact that the open and close prices are very close to each other
  3. Spinning tops conveys indecision in the market with both bulls and bears being in equal control
  4. Spinning top at the top end of the rally indicates that either the bulls are taking a pause before they can resume the uptrend further or the bears are preparing to break the trend. In either case, the trader’s stance has to be cautious. If the trader’s intent is to buy, he is better off buying only half the quantity and he should wait for the markets to move in his direction
  5. Spinning top at the bottom end of the rally indicates that either the bears are taking a pause before they can resume the down trend further or the bulls are preparing to break the trend and take the markets higher. Either case, the trader’s stance has to be cautious. If the traders intent is to buy, he is better off buying only half the quantity and he should wait for the markets to make the move
  6. Doji’s are very similar to spinning tops. Doji also convey indecision in the market. By definition dojis do not have a real body. However in reality, even if a wafer thin body appears it is acceptable
  7. A trader’s stance based on dojis is similar to stance taken when a spinning top occurs.

The Marubozu:

The Marubozu:

The word Marubozu means “Bald” in Japanese. There are two types of marubozu – the bullish marubozu and the bearish marubozu.


Marubozu is probably the only candlestick pattern which violates rule number 3 i.e look for prior trend. A Marubozu can appear anywhere in the chart irrespective of the prior trend, the trading implication remains the same.


  1. Buy strength and sell weakness
  2. Be flexible with patterns (verify and quantify)
  3. Look for prior trend


Marubozu as a candlestick with no upper and lower shadow (therefore appearing bald). A Marubozu has just the real body as shown below. However there are exceptions to this.


Bullish Marubozu:

The absence of the upper and lower shadow in a bullish marubozu implies that the low is equal to the open and the high is equal to the close. Hence whenever the, Open = Low and High = close, a bullish marubozu is formed.

A bullish marubozu indicates that there is so much buying interest in the stock that the market participants were willing to buy the stock at every price point during the day, so much so that the stock closed near its high point for the day. It does not matter what the prior trend has been, the action on the marubozu day suggests that the sentiment has changed and the stock in now bullish.

The expectation is that with this sudden change in sentiment there is a surge of bullishness and this bullish sentiment will continue over the next few trading sessions. Hence a trader should look at buying opportunities with the occurrence of a bullish marubozu. The buy price should be around the closing price of the marubozu.


Image result for bearish marubozu candlestick

Bearish Marubozu:

Bearish Marubozu indicates extreme bearishness. Here the open is equal to the high and close the is equal to low. Open = High, and Close = Low.

A bearish marubozu indicates that there is so much selling pressure in the stock that the market participants actually sold at every price point during the day, so much so that the stock closed near its low point of the day. It does not matter what the prior trend has been, the action on the marubozu day suggests that the sentiment has changed and the stock is now bearish.

The expectation is that this sudden change in sentiment will be carried forward over the next few trading sessions and hence one should look at shorting opportunities. The sell price should be around the closing price of the marubozu.

Key Points about Marubozu
  1. Remember the rules based on which candlesticks work
  2. Marubozu is the only pattern which violates rule number 3 i.e Look for prior trend
  3. A bullish marubozu indicates bullishness
    1. Buy around the closing price of a bullish marubozu
    2. Keep the low of the marubozu as the stoploss
  4. A bearish marubozu indicates bearishness
    1. Sell around the closing price of a bearish marubozu
    2. Keep the high of the marubozu as the stoploss
  5. An aggressive trader can place the trade on the same day as the pattern forms
  6. Risk averse traders can place the trade on the next day after ensuring that it obeys rule number 1 i.e Buy strength, and Sell weakness
  7. An abnormal candle lengths should not be traded
    1. Short candle indicates subdued activity
    2. Long candle indicates extreme activity, however placing stoploss becomes an issue.


Observing CandleStick Patterns

candlesticks can be broken down into single candlestick pattern and multiple candlestick patterns.

Under the single candlestick pattern we will be learning the following…


  1. -Marubozu
    1. -Bullish Marubozu
    2. -Bearish Marubozu
  2. -Doji
  3. -Spinning Tops
  4. -Paper umbrella
    1. -Hammer
    2. -Hanging man
  5. -Shooting star

Multiple candlestick patterns are a combination of multiple candles. Under the multiple candlestick patterns we will learn the following:

  1. Engulfing pattern
    1. Bullish Engulfing
    2. Bearish Engulfing
  2. Harami
    1. Bullish Harami
    2. Bearish Harami
  3. Piercing Pattern
  4. Dark cloud cover
  5. Morning Star
  6. Evening Star
Few assumptions specific to candlesticks

Before we jump in and start learning about the patterns, there are few more assumptions that we need to keep in mind. These assumptions are specific to candlesticks. Do pay a lot of attention to these assumptions as we will keep referring back to these assumptions quite often later.

At this stage, these assumptions may not be very clear to you. I will explain them in greater detail as and when we proceed. However, do keep these assumptions in the back of your mind:

  • Buy strength and sell weakness – Strength is represented by a bullish (blue) candle and weakness by a bearish (red) candle. Hence whenever you are buying ensure it is a blue candle day and whenever you are selling, ensure it’s a red candle day.
  • Be flexible with patterns (quantify and verify) – While the text book definition of a pattern could state a certain criteria, there could be minor variations to the pattern owing to market conditions. So one needs to be a bit flexible. However one needs to be flexible within limits, and hence it is required to always quantify the flexibility.
  • Look for a prior trend – If you are looking at a bullish pattern, the prior trend should be bearish and likewise if you are looking for a bearish pattern, the prior trend should be bullish.

Technical Analysis

A good point of view should have a directional view and should also include information such as:


  • Price at which one should buy and sell stocks
  • Risk involved
  • Expected reward
  • Expected holding period

Technical Analysis (also abbreviated as TA) is a popular technique that allows you to do just that. It not only helps you develop a point of view on a particular stock or index but also helps you define the trade keeping in mind the entry, exit and risk perspective.

Technical Analysis is a research technique to identify trading opportunities in market based on the actions of market participants. The actions of markets participants can be visualized by means of a stock chart. Over time, patterns are formed within these charts and each pattern conveys a certain message. The job of a technical analyst is to identify these patterns and develop a point of view.

Like any research technique, technical analysis stands on a bunch of assumptions. As a practitioner of technical analysis, you need to trade the markets keeping these assumptions in perspective.

Key points to be noted in Technical Analysis:

  1. Trades – TA is best used to identify short term trades. Do not use TA to identify long term investment opportunities. Long term investment opportunities are best identified using fundamental analysis. Also, If you are a fundamental analyst, use TA to calibrate the entry and exit points
  2. Return per trade – TA based trades are usually short term in nature. Do not expect huge returns within a short duration of time. The trick with being successful with TA is to identify frequent short term trading opportunities which can give you small but consistent profits.
  3. Holding Period – Trades based on technical analysis can last anywhere between few minutes and few weeks, and usually not beyond that. We will explore this aspect when we discuss the topic on timeframes.
  4. Risk ­– Often traders initiate a trade for a certain reason, however in case of an adverse movement in the stock, the trade starts making a loss. Usually in such situations, traders hold on to their loss making trade with a hope they can recover the loss. Remember, TA based trades are short term, in case the trade goes sour, do remember to cut the losses and move on to identify another opportunity.

Assumption in Technical Analysis:

1) Markets discount everything – This assumption tells us that, all known and unknown information in the public domain is reflected in the latest stock price. For example there could be an insider in the company buying the company’s stock in large quantity in anticipation of a good quarterly earnings announcement. While he does this secretively, the price reacts to his actions thus revealing to the technical analyst that this could be a good buy.

2) The ‘how’ is more important than ‘why’ – This is an extension to the first assumption. Going with the same example as discussed above – the technical analyst would not be interested in questioning why the insider bought the stock as long he knows how the price reacted to the insider’s action.

3) Price moves in trend –  All major moves in the market is an outcome of a trend. The concept of trend is the foundation of technical analysis. For example the recent upward movement in the NIFTY Index to 7700 from 6400 did not happen overnight. This move happened in a phased manner, in over 11 months. Another way to look at it is, once the trend is established, the price moves in the direction of the trend.

4) History tends to repeat itself – In the technical analysis context, the price trend tends to repeat itself. This happens because the market participants consistently react to price movements in a remarkably similar way, each and every time the price moves in a certain direction. For example in up trending markets, market participants get greedy and want to buy irrespective of the high price. Likewise in a down trend, market participants want to sell irrespective of the low and unattractive prices. This human reaction ensures that the price history repeats itself.

Wednesday, September 19, 2018

The Stock Market Index


The Index
Luckily you need not actually track these selected companies individually to get a sense of how the markets are doing. The important companies are pre packaged, and continuously monitored to give you this information. This pre packaged market information tool is called the ‘Market Index’.

There are two main market indices in India. The S&P BSE Sensex representing the Bombay stock exchange and CNX Nifty representing the National Stock exchange.
S&P stands for Standard and Poor’s, a global credit rating agency. S&P has the technical expertise in constructing the index which they have licensed to the BSE. Hence the index also carries the S&P tag.
CNX Nifty consists of the largest and most frequently traded stocks within the National Stock Exchange. It is maintained by India Index Services & Products Limited (IISL) which is a joint venture of National Stock Exchange and CRISIL. In fact the term ‘CNX’ stands for CRISIL and NSE.

Practical uses of the Index
Information – The index reflects the general market trend for a period of time. The index is a broad representation of the country’s state of economy. A stock market index that is up indicates people are optimistic about the future. Likewise when the stock market index is down it indicates that people are pessimistic about the future.

Benchmarking – For all the trading or investing activity that one does, a yardstick to measure the performance is required.  Assume over the last 1 year you invested Rs.100,000/- and generated Rs.20,000 return to make your total corpus Rs.120,000/- . How do you think you performed? Well on the face of it, a 20% return looks great. However what if during the same year Nifty moved to 7,800 points from 6,000 points generating a return on 30%?


Trading – Trading on the index is probably one of most popular uses of the index. Majority of the traders in the market trade the index. They take a broader call on the economy or general state of affairs, and translate that into a trade. Trades such as these are possible through what is known as ‘Derivative’ segment of the markets.

Portfolio Hedging – Investors usually build a portfolio of securities. A typical portfolio contains 10 – 12 stocks which they would have bought from a long term perspective. While the stocks are held from a long term perspective they could foresee a prolonged adverse movement in the market (2008) which could potentially erode the capital in the portfolio. In such a situation, investors can use the index to hedge the portfolio.

Different Types of Traders :

Difference between a Trader and Investor:


  • A trader is a person who spots an opportunity and initiates the trade with an expectation of profitably exiting the trade at the earliest given opportunity. 
  • A trader usually has a short term view on markets.  A trader is alert and on his toes during market hours constantly evaluating opportunities based on risk and reward. He is unbiased toward going long or going short.

There are different types of traders :
  1. Day Trader – A day trader initiates and closes the position during the day. He does not carry forward his positions. He is risk averse and does not like taking overnight risk. For example – He would buy 100 shares of TCS at 2212 at 9:15AM and sell it at 2220 at 3:20 PM making a profit of Rs.800/- in this trade. A day trader usually trades 5 to 6 stocks per day.
  2. Scalper – A type of a day trader. He usually trades very large quantities of shares and holds the stock for very less time with an intention to make a small but quick profit. For example – He would buy 10,000 shares of TCS as 2212 at 9:15 and sell it 2212.1 at 9.16. He ends up making 1000/- profit in this trade. In a typical day, he would have placed many such trades. As you may have noticed a scalp trader is highly risk averse.
  3. Swing Trader – A swing trader holds on to his trade for slightly longer time duration, the duration can run into anywhere between few days to weeks. He is typically more open to taking risks. For example – He would buy 100 shares of TCS at 2212 on 12th June 2014 and sell it 2214 on 19th June 2014.
Some of the really successful traders the world has seen are – George Soros, Ed Seykota, Paul Tudor, Micheal Steinhardt, Van K Tharp, Stanley Druckenmiller etc
An investor is a person who buys a stock expecting a significant appreciation in the stock. He is willing to wait for his investment to evolve. The typical holding period of investors usually runs into a few years. There are two popular types of investors..
  1. Growth Investors – The objective here is to identify companies which are expected to grow significantly because of emerging industry and macro trends. A classic example in the Indian context would be buying Hindustan Unilever, Infosys, Gillette India back in 1990s. These companies witnessed huge growth because of the change in the industry landscape thereby creating massive wealth for its shareholders.
  2. Value Investors – The objective here is to identify good companies irrespective of whether they are in growth phase or mature phase but beaten down significantly due to the short term market sentiment thereby making a great value buy. An example of this in recent times is L&T. Due to short term negative sentiment; L&T was beaten down significantly around August/September of 2013. The stock price collapsed to 690 all the way from 1200. At 690 (given its fundamentals around Aug 2013), a company like L&T is perceived as cheap, and therefore a great value pick. Eventually it did pay off, as the stock price scaled back to 1440 around May 2014.
Some of the really famous investors the world has seen – Charlie Munger, Peter Lynch, Benjamin Graham, Thomas Rowe, Warren Buffett, John C Bogle, John Templeton, etc.

Few key IPO jargons


  • Under Subscription – Let’s say the company wants to offer 100,000 shares to the public. During the book building process it is discovered that only 90,000 bids were received, then the issue is said to be under subscribed. This is not a great situation to be in as it indicates negative public sentiment
  • Over subscription – If there are 200,000 bids for 100,000 shares on offer then the issue is said to be oversubscribed 2 times (2x)
  •  Green Shoe Option – Part of the underwriting agreement which allows the issuer to authorize additional shares (typically 15 percent) to be distributed in the event of over subscription. This is also called the overallotment option
  •  Fixed Price IPO –Sometimes the companies fix the price of the IPO and do not opt for a price band. Such issues are called fixed price IPO
  • Price Band and Cut off price –Price band is a price range between which the stock gets listed. For example if the price band is between Rs.100 and Rs.130, then the issue can list within the range. Let’s says it gets listed at 125, then 125 is called the cut off price.

The Spinning Top and The Dojis